
| Home |
| About ElarmS |
| Application? - tell us |
| California |
| South Korea |
| Turkey |
| Methodology |
| Research Highlights |
| Technical Publications |
| Press Highlights |
| Contact us |
| Acknowledgements |
M5.2 October 24, 2006 in the southern Marmara Sea
ElarmS processing results
event: rr_20061024_140021_170021
Network lat 40.424 lon 28.9947 depth 14.3
Network mag 5.2
ElarmS Ntrigs: 19
ElarmS location: 40.3776016 29.028614
ElarmS Origin time error (s): 1.03253344
ElarmS Mtaup: 4.08726358 Ntaup: 6
ElarmS MPd: 6.14633226 NPd: 19
ElarmS Magnitude: 5.11679792
|
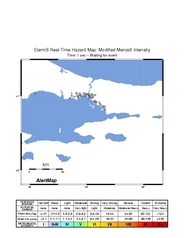
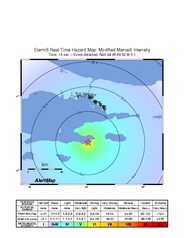
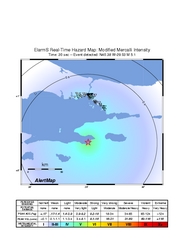
AlertMaps
AlertMaps are ElarmS' prediction of the coming ground shaking. AlertMaps are updated every second as more information is incorporated into the ElarmS predictions. As time progresses and the ground shaking spreads across a region the initially predictive AlertMaps evolve into a ShakeMap which is a map of the observed peak ground shaking. You can view the AlertMaps as an animation or look at individual frames. | ||
 Animation | ||
 Individual frames... |
|
|
|
Time histories
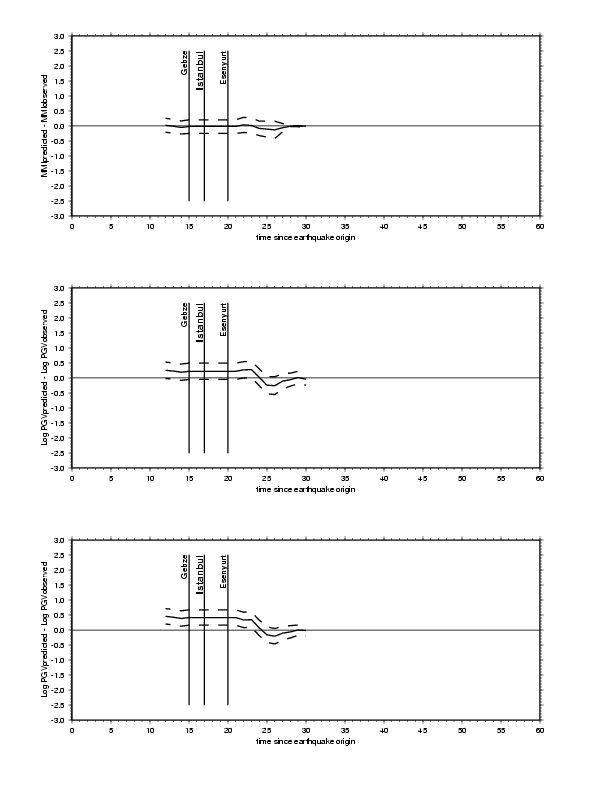
These time histories show the progress of the ElarmS algorithms with time.
The "Ground motion" plots show the error in the predicted ground shaking intensity
(using the MMI scale), the predicted peak ground acceleration (PGA) and the
predicted peak ground velocity (PGV).
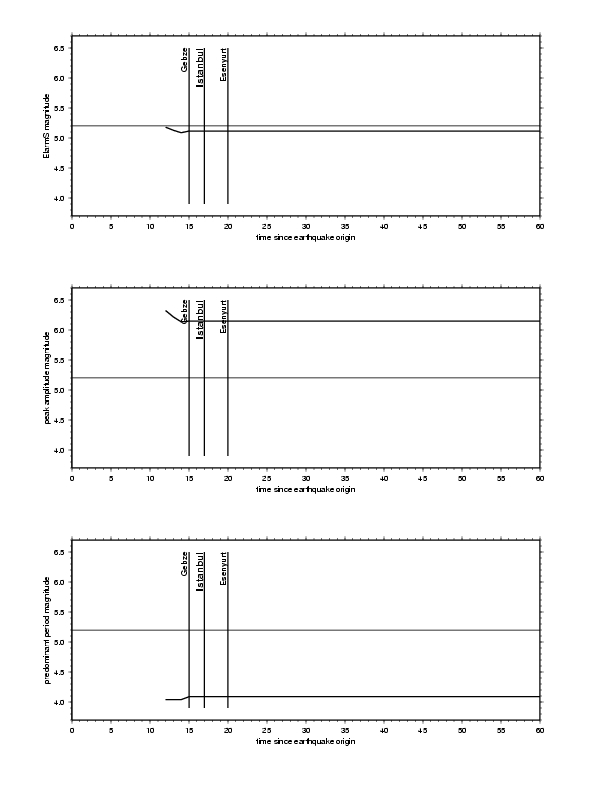
The "Magnitude" plots show the ElarmS magnitude estimate as a function of time.
The "ElarmS magnitude" uses observations of P-wave amplitude and frequency content.
The magnitude estimates using just the peak amplitude and just the predominant period
are also shown.
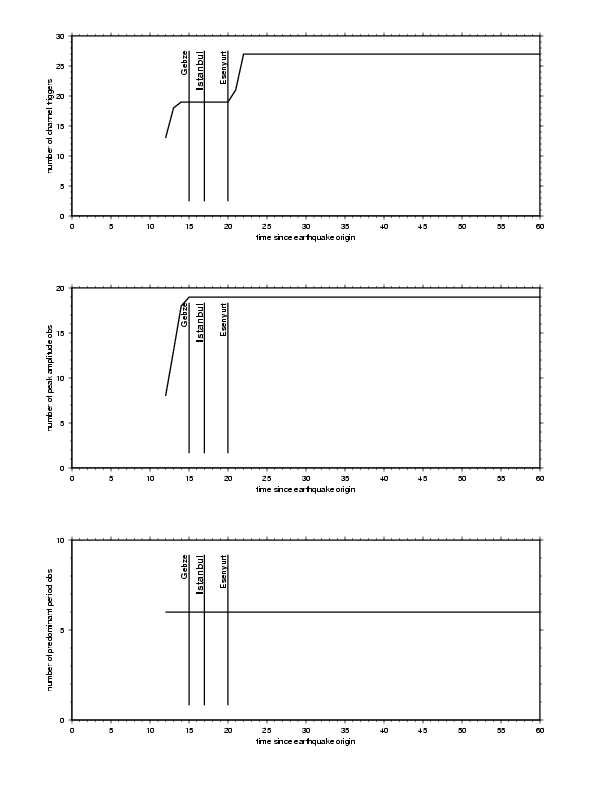
Finally the "Observations" plot shows the number of vertical channel triggers, the
number of P-wave peak amplitudes and predominant periods.
| ||
 Ground motion |
 Magnitude |
 Observations |